Last week, I participated in the Twitter trend where you share a summary of your GitHub contributions using this nice tool built by @jrieke. It counts your (public?) contributions and puts them into a nice little tweet. Mine was:
My year on #Github2020 🐙 friep
— Frie (@ameisen_strasse) January 5, 2021
📬 Commits/Issues/PRs: 1394
🏝️ Repos contributed to: 23
⭐ New stars: 14
🔥 Hottest: friep/vaccc19de_rki_data (+5)
Share your own stats: https://t.co/bvrxJFeOyI | Built by @jrieke w/ @streamlit
Wow, 1394 commits/issues/PRs! That’s quite a high number. So of course, I was suspicious and followed up with my own interpretation:
When ~ 30% of your commits are one line diffs..🤷🏼
— Frie (@ameisen_strasse) January 5, 2021
Of course, as a data person, making claims like this without actually looking at the data feels very sus, so I decided to have a look at those contributions - especially the commits - to find out where this high number really came from: “proper” commits or just a lot of desperate one-line “bug fix”, “fix” et al.?
Getting data: REST vs. GraphQL
REST API
In order to investigate my question, I needed to fetch the data. In particular, I wanted to download all commits that I made in 2020 to all repositories that I contributed to: not only my own but also commits to repos of other users / organizations. Having had used the GitHub REST API via the {gh} package before, my first instinct was to look there.
However, the REST API does not provide you with access to bird-view data like all your commits across repositories. 🐦 Instead, the focus of the REST API is on “resources”1 of the different entity types (repository, user, commits) on GitHub.
For example, you can do things like this with the REST API:
- repository: list your own repositories ->
GET /users/{username}/repos - issues: list issues in a repository -> -
GET /repos/{owner}/{repo}/issues - commits: list commits in a repository ->
GET /repos/{owner}/{repo}/commits
Of course, you are not restricted to getting (“GET”) resources from the REST API, you can also create (POST or PUT), modify (POST) and delete (DELETE) them. Those operations are also known as CRUD (create, read, update, delete).
With its focus on “resources”, the REST API is not good at providing data that span across resources of the same type. At least, you can get easily get resources that are nested in another resource such as commits in a specific repository. But there is no endpoint to give you your contributions across repositories - something I’d need to get “all commits that I made in 2020 to all repositories that I contributed to”. In order to get data like this we have to resort to the GraphQL API.2
GraphQL API
So what is this GraphQL?
GraphQL is a query language for APIs and a runtime for fulfilling those queries with your existing data. (Source)
I had never worked with a GraphQL API before writing this post but from what I understand now, is that its main concept is an entity graph that connects all entities from a business model. So instead of thinking about resources, you conceptualize your business entities as nodes in a graph that are connected with edges.
So how is it different in practice from a REST API?
The major difference is probably on the client / user side3. Instead of making calls to different, clearly defined REST endpoints corresponding to resources, you “simply” specify the data that you want to get back from the API4. Indeed, there is only one endpoint for the whole GitHub GraphQL: https://api.github.com/graphql. Sounds weird? Yup. Let’s see how works in my specific case to get “all commits that I made in 2020 to all repositories that I contributed to” .
(Finally) getting the data
Setup
First, I load some packages: Of course, the usual tidyverse suspects but also {ghql} which will help us to make calls against the GitHub GraphQL API:
Following the README of {ghql}, we create a connection to the GraphQL API and load the schema.
token <- Sys.getenv("GITHUB_GRAPHQL_TOKEN")
con <- GraphqlClient$new(
  url = "https://api.github.com/graphql",
  headers = list(Authorization = paste0("Bearer ", token))
)
con$load_schema()
Defining queries
So far, so good (and boring). Now, for the queries. As mentioned above, you are supposed to be able to “just” specify the data that you want to get back. So in theory, I should be able to just define in one query that I wanted to get “all commits that I made in 2020 to all repositories that I contributed to”. Ha, well, well.. Turns out, having all the control over what you want to get back has one major disadvantage: complexity. It took a lot of playing around with the interactive GraphQL Explorer and browsing the GitHub community forum to come up with a strategy that a) reduced the complexity and b) was possible given the API limits5:
- get all repositories I have contributed to6
- for each repository, get all commits made by myself.
This definitely does not make use of all the power of the GraphQL API but I already had spent too much time on this, so it had to do. So here are the two queries. I won’t go into detail on them but I added some hopefully helpful comments before each query (somehow {ghql} does not accept comments in the queries). Please also note that the display of the query string assignments is weird.. obviously the assignment is before the string and not after it. If you copy it into RStudio, it should be correct.
qry <- Query$new()

# id
# this is the internal github id that we need later

# repositoriesContributedTo
# all repos i contributed to with at least 1 commit
# "first" can be maximum 100
# see https://docs.github.com/en/free-pro-team@latest/graphql/overview/resource-limitations#node-limit)

# pageInfo
# pagination info in case you have contributed to more than 100 repositories

# you add queries to the Query object with the query function
q1 <- '
  query getContributedRepos ($userLogin: String!) {
    user(login: $userLogin) {
      id
      repositoriesContributedTo(first: 100, contributionTypes: [COMMIT], includeUserRepositories: true)       {
        nodes {
          name
          owner {
            login
          }
        }
        pageInfo {
          endCursor
          hasNextPage
        }
        totalCount
      }
    }
  }
'

qry$query('repos_contributed_to', q1)
The query for step 2:
# adapted from: https://stackoverflow.com/a/48286191/6276235
# query arguments
# name: name of the repository (without owner), e.g. correlaid-utils
# owner: owner of repository, e.g. friep
# authorId: the internal user id we got in the previous query
# after: optional argument if we need to paginate

# default branch - useful because i do not know whether all my repos have switched to main
# target - the object the ref points to - git internals here!
# ...on Commit - shamelessly copied from somewhere. seems like it is a fragment spread, similar to here: https://spec.graphql.org/June2018/#sec-Fragment-Spread-Type-Existence
# history - get commit history - again max value for first = 100. I filter for my own commits
  # after is used for pagination
# nodes - here we get all the interesting data
# pageInfo - this is needed for the pagination
  # hasNextPage is boolean and if true, we need to take endCursor as "after" for the next call
# totalCount - total commit count regardless of pagination
  # useful to preallocate a list
q2 <- '
query getCommits($name: String!, $owner: String!, $authorId: String!, $after: String)
  {
  repository(name: $name, owner: $owner) {
    defaultBranchRef {
      target {
        ... on Commit {
          history(first: 100, author: {id: $authorId}, after: $after) {
           nodes {
              commitUrl
              deletions
              additions
              author {
                user {
                  login
                }
                email
                name
              }
              message
              messageBody
              changedFiles
              committedDate
              oid
              committedViaWeb
              pushedDate
           }

            pageInfo {
              hasNextPage
              hasPreviousPage
              endCursor
            }
            totalCount
          }
        }
      }
    }
  }
}'

qry$query('repo_commits', q2)
Helper functions
Next, I defined some small utility functions to improve the readability of my code by wrapping up common list extractions etc.:
# execute query in qry object
exec_query <- function(query_name, variables) {
  if (!query_name %in% names(qry$queries)) {
    stop(glue::glue("Query {query_name} does not exist."))
  }
  str_vars <- paste(glue::glue("{names(variables)}: {variables}"), collapse = "\n")
  print(glue::glue("Executing query {query_name} with variables: \n{str_vars}"))
  l <- jsonlite::fromJSON(con$exec(qry$queries[[query_name]], variables))
  if (!is.null(l$errors)) {
    err_msg <- l$errors$message
    stop(glue::glue("Something went wrong during the execution of {query_name}: {err_msg}"))
  } else {
    return(l)
  }
}

# extract the page info from the result list to one of the repo queries
extract_page_info <- function(l) {
  l$data$repository$defaultBranchRef$target$history$pageInfo
}

# extract the history from the result list of one of the repo queries
extract_history <- function(l) {
  l$data$repository$defaultBranchRef$target$history
}
I used all of those utility functions to write one function to get my commits in a given repo:
get_my_commits_in_repo <- function(owner, name, author_id) {
  print(glue::glue("-----------\nprocessing repository {owner}/{name}"))

  # initial call
  # after is set to NA
  repo_commits_l <- exec_query("repo_commits", list(owner = owner, name = name, authorId = author_id, after = NA))
  # allocate list based on number of total commits in repo.
  # we can fetch 100 commits per request so we need to allocate a list of length ceiling(total_count / 100)
  total_count <- ceiling(extract_history(repo_commits_l)$totalCount)
  res <- vector(mode = "list", length = ceiling(total_count / 100))

  # extract data frame and flatten it and add to result list
  res[[1]]  <- extract_history(repo_commits_l)$nodes %>% jsonlite::flatten()

  i <- 2 # counter for later datasets to be stored in res
  while (extract_page_info(repo_commits_l)$hasNextPage) {
    # run followup query
    # extract cursor from pagination info
    after_val <- extract_page_info(repo_commits_l)$endCursor

    # make next call and overwrite list
    repo_commits_l <- exec_query("repo_commits", list(owner = owner, name = name, authorId = author_id, after = after_val))

    # extract dataframe and add to list
    res[[i]] <- extract_history(repo_commits_l)$nodes %>% jsonlite::flatten()
    i <- i + 1
  }

  # add variables from the arguments
  all_repo_commits <- dplyr::bind_rows(res)
  all_repo_commits$owner <- owner
  all_repo_commits$name <- name
  all_repo_commits$name_with_owner <- paste(owner, name, sep = "/")
  return(all_repo_commits)
}
Collect: Step 1
Finally, collect the data! First, I get all repos that I have contributed to. After having tested this in the explorer, I knew the total number of repositories was only ~50, so I did not implement pagination here:
# Step 1
repos_contributed_to <- exec_query("repos_contributed_to", list(userLogin = "friep"))
if (repos_contributed_to$data$user$repositoriesContributedTo$totalCount > 100) {
  warning("You contributed to more than 100 repositories. If you want to get data for all of them, please implement some paging here (see get_my_commits_in_repo for inspiration).")
}
repos <- repos_contributed_to$data$user$repositoriesContributedTo$nodes %>% jsonlite::flatten()
glimpse(repos)
Collect: Step 2
For the second step, I used purrr::pmap_dfr to feed the repository details as arguments to the get_my_commits_in_repo function:
# step 2
arg_df <- repos %>%
  dplyr::rename(owner = owner.login) %>% # arguments need to be called as in function definition
  dplyr::mutate(author_id = repos_contributed_to$data$user$id) # add my user id (constant)

# pmap takes each row as arguments for the function
all_commits <- purrr::pmap_dfr(arg_df, get_my_commits_in_repo)
all_commits %>% readr::write_rds("all_commits.rds")
Analysis
First, let’s do some data cleaning and preparation for the plotting. And most importantly, filter the commits so that I only keep those made in 2020:
all_commits <- readr::read_rds("all_commits.rds")
commits_2020 <- all_commits %>%
  mutate(committedTs = lubridate::ymd_hms(committedDate)) %>%
  filter(committedTs > "2019-12-31" & committedTs < "2021-01-01")

total <- nrow(commits_2020)
glimpse(commits_2020)
Rows: 1,111
Columns: 17
$ commitUrl         <chr> "https://github.com/friep/correlaid-utils…
$ deletions         <int> 2, 5, 3, 7, 30, 6, 0, 0, 0, 3, 1, 2, 1, 1…
$ additions         <int> 6, 2, 3, 6, 157, 4, 8, 45, 10, 0, 1, 2, 1…
$ message           <chr> "Merge branch 'main' of github.com:friep/…
$ messageBody       <chr> "# Conflicts:\n#\tREADME.md", "", "", "",…
$ changedFiles      <int> 4, 2, 3, 2, 6, 2, 1, 2, 1, 1, 1, 1, 1, 1,…
$ committedDate     <chr> "2020-12-13T13:43:56Z", "2020-12-13T13:42…
$ oid               <chr> "a20c20c482508a82b7ebc07584a6e9762a835caa…
$ committedViaWeb   <lgl> FALSE, FALSE, FALSE, FALSE, FALSE, FALSE,…
$ pushedDate        <chr> "2020-12-13T13:44:03Z", NA, "2020-12-13T1…
$ author.email      <chr> "fr1e@pm.me", "fr1e@pm.me", "fr1e@pm.me",…
$ author.name       <chr> "Frie", "Frie", "Frie", "Frie", "Frie", "…
$ author.user.login <chr> "friep", "friep", "friep", "friep", "frie…
$ owner             <chr> "friep", "friep", "friep", "friep", "frie…
$ name              <chr> "correlaid-utils", "correlaid-utils", "co…
$ name_with_owner   <chr> "friep/correlaid-utils", "friep/correlaid…
$ committedTs       <dttm> 2020-12-13 13:43:56, 2020-12-13 13:42:57…
Total commit number: 11117
Let’s dive into them!
Where did I make all those commits?
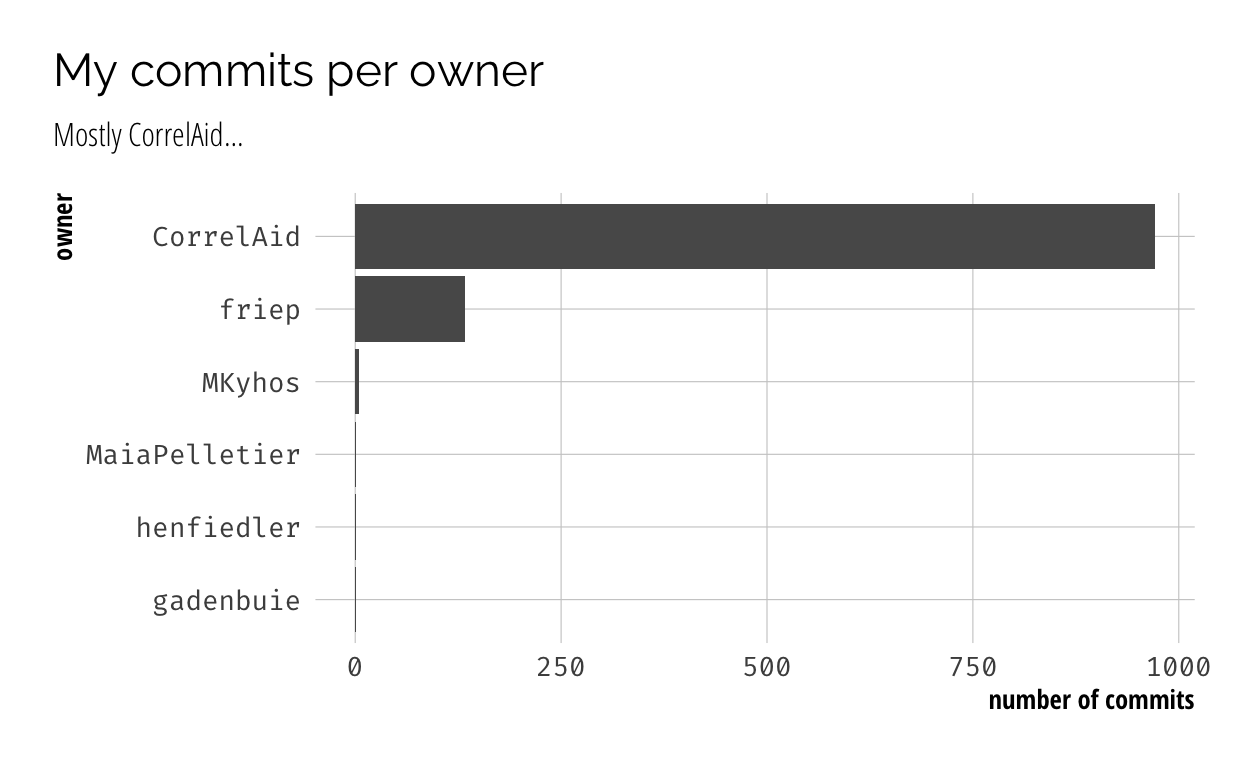
To get a first impression, it’s worthwhile to look at where I made my commits. Unsurprisingly, most of my commits were made in CorrelAid repositories, followed by my own, and some other ones stemming from PRs to fix typos and proofreading a thesis of a friend.
Show code
ggplot(commits_2020, aes(x = fct_reorder(owner, owner, function(x) length(x))))+
  geom_bar()+
  coord_flip()+
  labs(x = "owner", y = "number of commits", title = "My commits per owner", subtitle = "Mostly CorrelAid...")
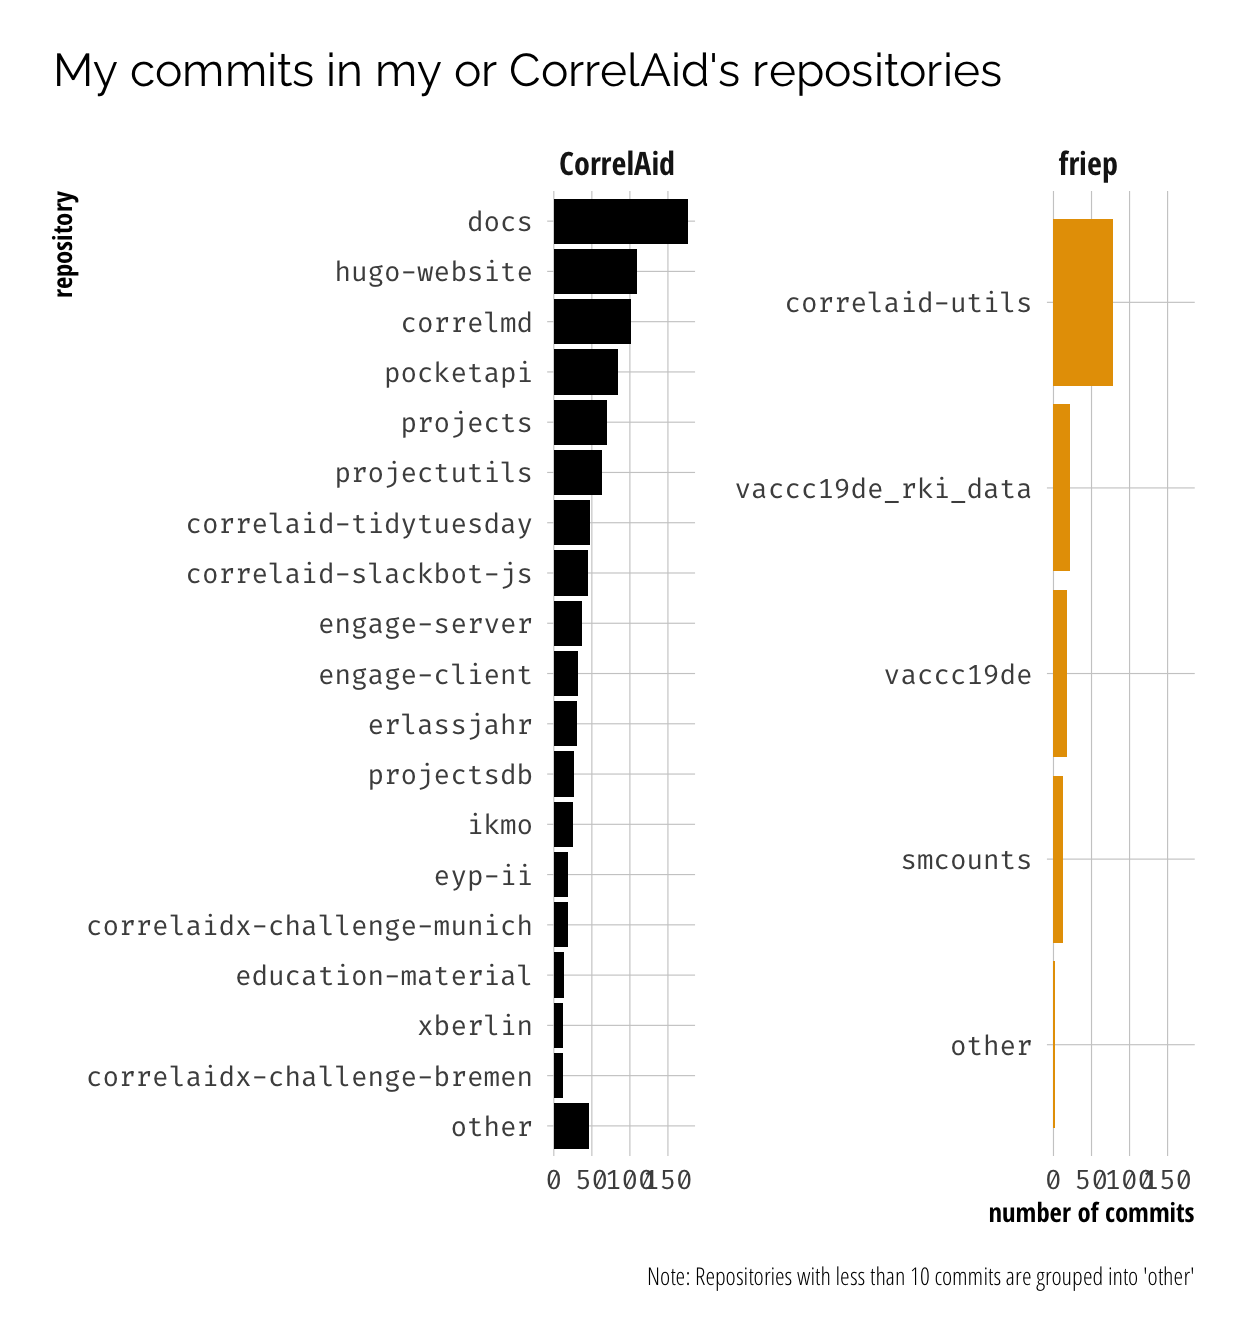
Looking at CorrelAid’s and my own repositories in more detail, you can see that I tried to incoroporate as much coding into my non-coding job (COO) wherever possible, from working on documentation (docs8), coding our website (hugo-website), maintaining a CodiMD instance (correlmd), developing a slackbot (correlaid-slackbot-js) to managing public project data in GitHub (projects, projectsdb, projectutils). In fact, I have already been jokingly awarded a second job title of “CTO” by a friend 😆. But of course, I also supported our project teams with some little contributions here and there, e.g. to collect our TidyTuesday contributions or enable hosting of our CorrelAidX challenge entries.
Show code
tmp <- commits_2020 %>%
  filter(owner %in% c("friep", "CorrelAid")) %>%
  mutate(name_lump = as.character(fct_lump_min(name, min = 10, other_level = "other")))

ggplot(tmp, aes(x = forcats::fct_reorder(name_lump, name_lump, function(x) {
    if(unique(x) == "other") -1000 else length(x) })))+ # force "Other" to be at bottom
  geom_bar(aes(fill = owner), show.legend = FALSE)+
  coord_flip()+
  labs(x = "repository", y = "number of commits", title = glue::glue("My commits in my or CorrelAid's repositories"), caption = "Note: Repositories with less than 10 commits are grouped into 'other'")+
  facet_wrap(~owner, scales = "free_y", ncol = 2)
The question of all questions
But enough of this…Let’s finally answer the original question… are ~ 30% of my commits one-line diffs?
🥁🥁🥁
No. But they do make up 12.51% of all commits.
Show code
| deletions | additions | changedFiles | ncommits | perc |
|---|---|---|---|---|
| 1 | 1 | 1 | 139 | 12.51 |
| 0 | 0 | 1 | 36 | 3.24 |
| 0 | 1 | 1 | 36 | 3.24 |
| 0 | 2 | 1 | 29 | 2.61 |
| 2 | 2 | 1 | 25 | 2.25 |
| 0 | 3 | 1 | 15 | 1.35 |
| 2 | 2 | 2 | 15 | 1.35 |
| 3 | 3 | 1 | 11 | 0.99 |
| 1 | 0 | 1 | 10 | 0.90 |
| 1 | 2 | 1 | 10 | 0.90 |
Show code
library(apexcharter)
del_adds <- commits_2020 %>%
  group_by(deletions, additions) %>%
  count(name = "ncommits")
categories <- sample(del_adds_gf$additions, 60)
tmp <- del_adds_gf %>%
  ungroup() %>%
  mutate(additions_m = sample(categories, nrow(del_adds_gf), replace = T))

apex(data = tmp, type = "treemap", height = "800px", width = "800px", mapping = aes(x = deletions, y = ncommits, z = changedFiles, fill = as.character(additions_m))) %>%
    ax_legend(show=FALSE, showForSingleSeries = FALSE, showForZeroSeries = FALSE, showForNullSeries = FALSE, position="right", fontSize = 0)
Show code
library(apexcharter)
del_adds <- commits_2020 %>%
  group_by(deletions, additions) %>%
  count(name = "ncommits")

apex(data = tmp, type = "treemap", mapping = aes(x = deletions, y = ncommits, z = changedFiles, group = additions, label = additions)) %>%
  ax_legend(show = FALSE) %>%
  ax_title(text = "Treemap number of commits by number of additions & deletions & changed files") %>%
  ax_subtitle(text = "the larger the area, the more commits") %>%
  ax_tooltip(custom = JS(paste(
    "function({ series, seriesIndex, dataPointIndex, w }) {",
    "console.log(w); return (",
    "'<div>' +",

    "'<span class = \"apexcharts-tooltip-text-label\">' +",
    "'Deletions: ' +",
    "'</span>' +",
    "'<span class = \"apexcharts-tooltip-text-value\">' +",
    "w.config.series[seriesIndex].data[dataPointIndex].x +",
    "'</span>' +",

    "'</br>' +",

    "'<span class = \"apexcharts-tooltip-text-label\">' +",
    "'Additions: ' +",
    "'</span>' +",
    "'<span class = \"apexcharts-tooltip-text-value\">' +",
    "w.config.series[seriesIndex].data[dataPointIndex].label +",
    "'</span>' +",


    "'</br>' +",

        "'<span class = \"apexcharts-tooltip-text-label\">' +",
    "'Changed files: ' +",
    "'</span>' +",
    "'<span class = \"apexcharts-tooltip-text-value\">' +",
    "w.config.series[seriesIndex].data[dataPointIndex].z +",
    "'</span>' +",


    "'</br>' +",

    "'<span class = \"apexcharts-tooltip-text-label\">' +",
    "'Number of commits: ' +",
    "'</span>' +",
    "'<span class = \"apexcharts-tooltip-text-value\">' +",
    "w.config.series[seriesIndex].data[dataPointIndex].y +",
    "'</span>' +",


    "'</div>' +",
    "'</div>' +",

    "'</div>'",
    ");",
    "}", sep = "\n"
  )))
Even if I added the 0-1-0 (0 deletions, 1 addition, 1 changed file) and the 1-0-1 commits, one-line commits would only amount to 16.65%.
But wait? Is this even true? Do 1 deletion and 1 addition in 1 file even mean that it was in the same line? Or could it be that the addition was made in line x while the deletion was made in line y?
Answering this question would require a deeper analysis of the patches of each commit. Which I tried…but eventually was too lazy to finish. To (most likely) quote my own BA and MA theses: “more research is necessary”.
Bonus: CI/CD and Docker frustration
Instead of parsing patches, I had a look at which files I changed in those “small commits”. Why? Because I remember a lot of angrily changing the same f***ing line in a GitHub Action or docker-compose yml file over and over again because the CI/CD pipeline just kept failing or the container kept crashing… Put your hand up if you can relate! 🙋
To get more information on the files which were changed in the “small” commits, we have to go back to the REST API because this information cannot be retrieved via the GraphQL API yet:
Show code
library(gh)
library(tibble)

# first filter the commits_2020 to get the small commits
small_commits <- commits_2020 %>%
  filter((changedFiles == 1 & additions < 2 & deletions < 2) & !(additions == 0 & deletions == 0))

# small wrapper function to get a commit from the REST API
get_commit <- function(name, owner, ref) {
  l <- gh::gh("GET /repos/{username}/{repo}/commits/{ref}", username = owner, repo = name, ref = ref)
  pb$tick()$print() # progress bar
  return(l)
}

# create a data frame with the arguments for the function
arg_df <- small_commits %>%
  rename(ref = oid) %>%
  select(name, owner, ref)

# gives back a list of lists
pb <- progress_estimated(nrow(arg_df))
small_commits_l <- pmap(arg_df, get_commit)

# we only want the information on the files
# very hacky purrr
small_commits_files <- small_commits_l %>%
  map("files") %>%
  map(function(l) map_dfr(l, as_tibble)) %>%
  bind_rows()

small_commits_files %>% readr::write_rds("small_commits_files.rds")
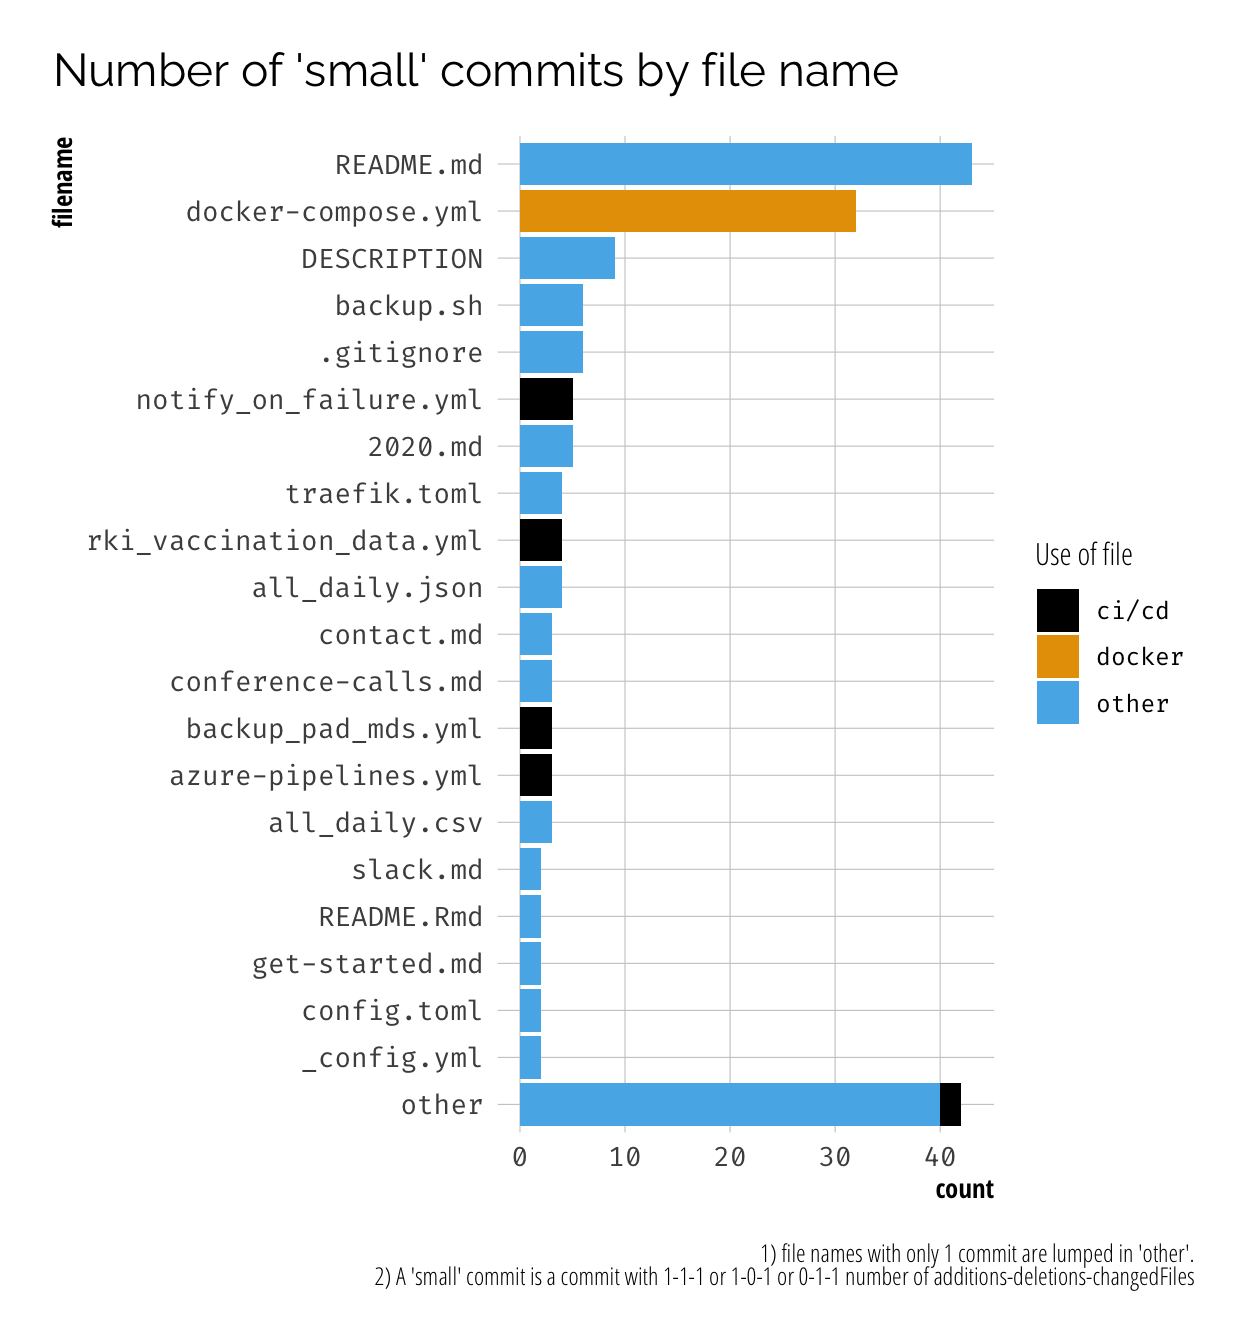
The plot confirms my suspicions. A lot of small changes to READMEs and when working on docker-compose, CI/CD related files or other configuration files like DESCRIPTION… which is the config for R packages. 🤷
Show code
small_commits_files <- readr::read_rds("small_commits_files.rds")

tmp <- small_commits_files %>%
  mutate(is_docker_compose = stringr::str_ends(filename, "docker-compose.yml|docker-compose.yaml|Dockerfile"),
         is_ci_cd = stringr::str_detect(filename, ".github/workflows|azure-pipelines.yml"),
         file_type = if_else(is_docker_compose, "docker", if_else(is_ci_cd, "ci/cd", "other"))) %>%
  mutate(file = fs::path_file(filename)) %>%
  mutate(file_lump = fct_lump_min(file, min = 2, other_level = "other"))

ggplot(tmp, aes(x = fct_reorder(file_lump, file_lump, function(x) {
    if(unique(x) == "other") -1000 else length(x)}), fill = file_type))+
  geom_bar()+
  scale_fill_discrete("Use of file")+
  coord_flip()+
  labs(title = "Number of 'small' commits by file name", x = "filename", caption = "1) file names with only 1 commit are lumped in 'other'.<br>2) A 'small' commit is a commit with 1-1-1 or 1-0-1 or 0-1-1 number of additions-deletions-changedFiles")
The end
So… what is the takeaway of this post? Should we all start using the GraphQL API for our GitHub-related data analyses? Well, as always, I think it depends. If you have a clear use case in mind which is easily and quickly done with one or a couple of REST API calls, then by all means there is no reason to change anything. If, however, you want to collect data which is not available through the REST API or would require hundreds of REST API calls (like I had to do to get the details on the 185 “small commits”), then you might want to have a look at the GraphQL API and the {ghql} R package.9
Finally, there are still some fun analyses which I did not do in this blog post (which is already way too long), so maybe there will be a follow-up post to this one. 👀 Until then: lets keep coding ❤️.
cf. https://graphql.org/learn/serving-over-http/#uris-routes↩︎
You can read more about GitHub’s own reasoning about REST vs GraphQL in this interesting blog post from 2016 when they announced their switch to GraphQL.↩︎
Backend programming is not the focus of this post so here’s a short summary what I took away from cross-reading the docs: You’d implement a GraphQL server by first defining a schema and then implementing so-called “resolvers” and “connectors” that map data from your data source (e.g. a Postgres database) to objects that fit to your schema. A tutorial in the Apollo framework can be found here.↩︎
I want to say I was not able to write a single, all-mighty query because of the API limits…but more likely, it was the complexity 🤯↩︎
Because I migrated all my repositories to GitLab in 2019 and generally only became really active last year, I did not have to worry about having too many repos. That’s also why I did not implement paging for this.↩︎
That’s different from the contributions in the tweet but those included PRs + issues which I’m not including in my analysis.↩︎
This repo is also special because those commits are made by editing the documentation via the Gitbook interfacce. So you could actually argue that those are not “real” commits anyway.↩︎
I also found that using the outputs of the GraphQL calls were usually more easily parse-able than the lists returned by
gh…If you check the code, you’ll see a lot ofjsonlite::fromJSON() %>% jsonlite::flattenthat yielded nice dataframes. :)↩︎